Wireless neoVI Analytics
Real-Time Visual Analytics of Low Resolution Data through Graphical Metrics.Overview
Real-Time Visual Analytics of Low Resolution Data through Graphical Metrics.
Wireless neoVI (WiVI) Analytics is a modern and dynamic reporting and data visualization platform, enabling all users to define, track and visualize In-Vehicle Signals, Diagnostics data, Logger Health Info, Custom Metrics and KPIs over any period of time. With Wireless neoVI Analytics, you can easily spot and investigate Trends and forecasts, Signals Anomalies and In-depth DTC Analysis. Wireless neoVI Analytics is the ultimate solution for data-driven decision making in the automotive industry.
Applications
- Fleet Management & Live Reports
- Performance Analysis of Fleets and Vehicles
- Diagnostics & Emissions Analysis
Features
- Save time and money by analyzing hundreds of gigabytes of in-vehicle data with Wireless neoVI powerful and scalable platform
- Reduce storage costs by compressing and filtering raw data for metrics and KPI tracking
- Simplify data modeling and data science tasks with WivI Analytics intuitive and code-free interface
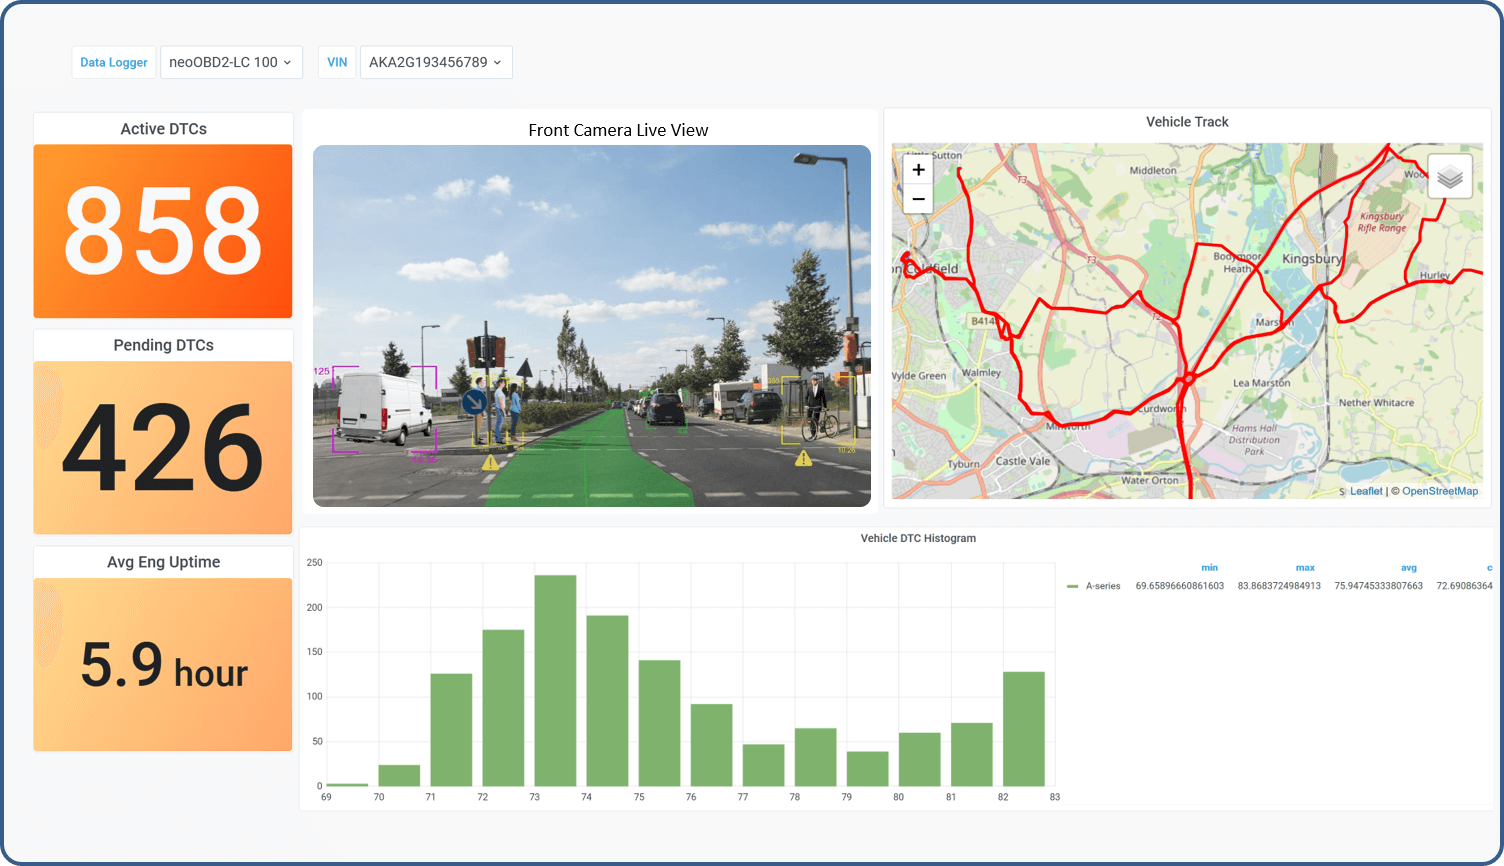
- Detects and diagnoses issues or anomalies in the field as soon as they occur, such as GPS malfunctions, voltage problems, logger temperature issues, etc.
- Correlate metrics and data across fleet, vehicle and ECU levels to monitor the impact of software updates and diagnose codes (DTCs)
- Enjoy seamless compatibility with all WIFI-connected hardware solutions and full integration in the WIVI ecosystem
Fleet Dashboards & Real-Time Reports
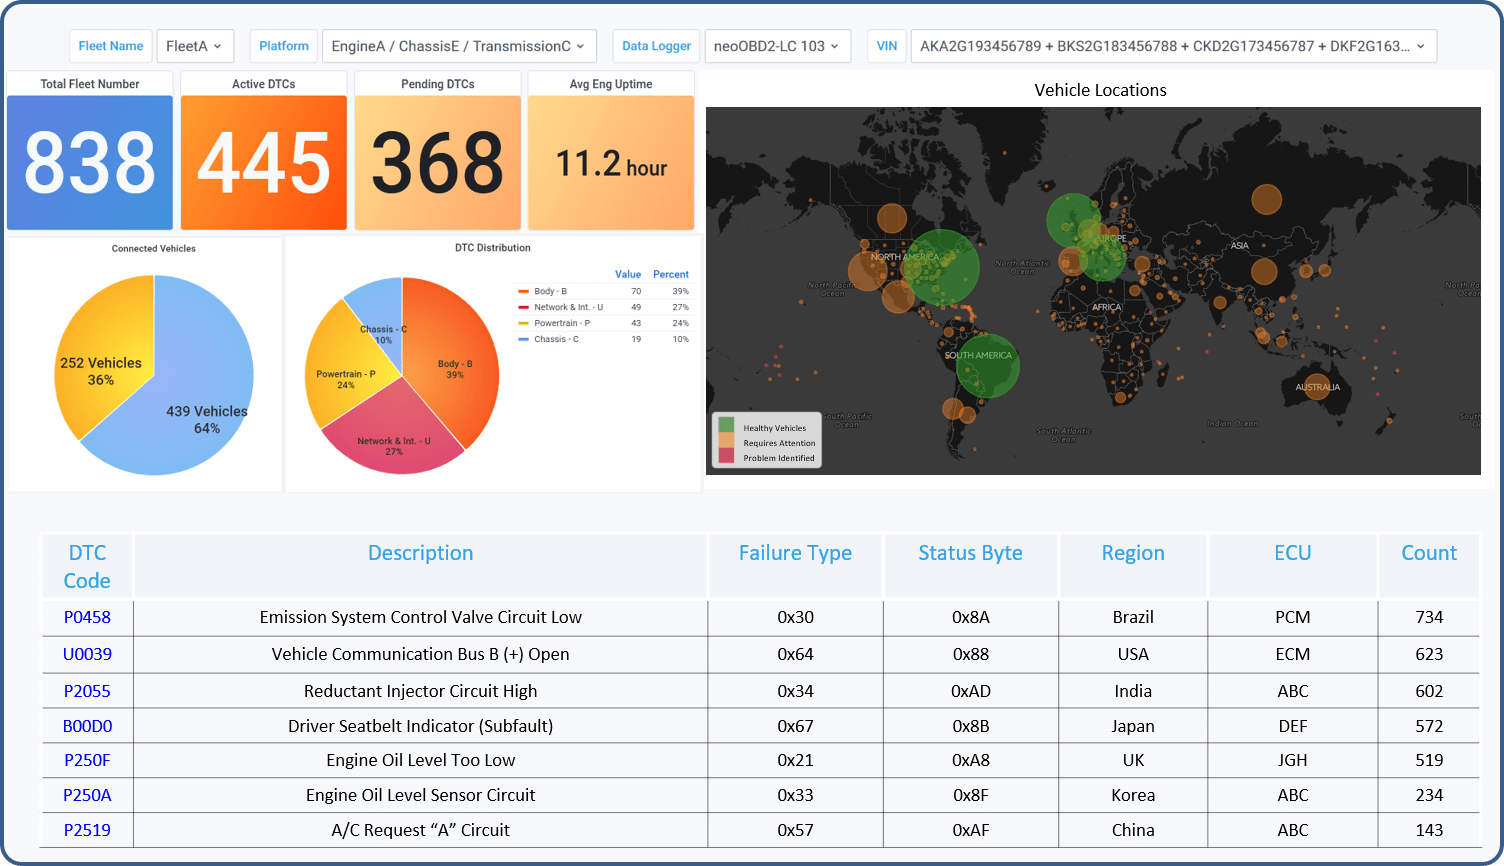
Managing multiple fleets can be a daunting task without the right tools. That’s why we created our fleet dashboards, a powerful solution that lets you monitor and analyze the most important metrics and KPIs for your fleets. Our fleet dashboards are designed by experts in in-vehicle network technology, who know what data matters most for your business. With our fleet dashboards, you can:
- See real-time information on all your fleets and vehicles, such as signal data, metrics, and KPIs
- Track the location and status of each vehicle with live GPS and markers
- Visualize big data with low latency and high accuracy
- Choose the time frame of analysis that suits your needs
- Set up custom rules and alerts for critical events or anomalies
- Generate and export reports automatically
Benefits:
- Gain a clear understanding of your fleet performance and trends
- Compare and benchmark different periods of time or fleets
- Get immediate results with pre-processed data instead of post-processing
- Receive timely notifications of important events or issues
Performance Analysis of Fleets and Vehicles
Wireless neoVI Analytics allows you to compare and benchmark different modules, software versions, and part numbers across your fleets and vehicles. You can also analyze how ambient conditions, geolocation, calibration process, and DTCs influence your ECU performance. Wireless neoVI analytics uses proprietary diagnostics and calibration data to provide you with accurate and reliable results. With our Wivi Analysis software you can:
- Improve your ECU software quality and efficiency
- Reduce your battery consumption and emissions
- Enhance your fleet and vehicle performance and safety
- Save time and money by automating your analysis process
Diagnostics & Emissions Optimization
Diagnostics & Emissions data is vital for developing and testing new products. Our Wireless neoVI Analytics dashboards help the user to optimize the diagnostics performance and reduce the emissions impact by linking them with other indicators, enabling the user to find and fix the problems faster.


